Physics Lab Report
Vardaan Sinha
Mr. Liao
AP Physics
18 August 2022
Lab #1: Measurements & Graphical Analysis
Purpose Statement: The purpose of the lab is to find the relationship between the mass and radius of the disks and to calculate the uncertainty of the measured values through graphical analysis methods, such as linearization, where the graph shows a directly proportional relationship between the independent and dependent variables.
Derived Equation:
-
p = m/v → m = vp
-
V = ah
-
m = (\pi r^{2})hp
-
This equation shows that the mass of the disk is equal to the surface area of the disk (in other words, the area of a circle) multiplied by the height of the disk by the density of the disk.
-
Experiment Outline:
-
Measure the mass of the disk using the balance. Before using the balance, it must be zeroed, and then the disk can be placed on the balance.
-
Measure the radius of the disk using the meter stick. The radius is measured by placing one end of the meter stick in the center of the circle, and the other end on the outside edge of the circle.
-
Repeat Steps 1 & 2 for each disk.
-
Measure the thickness of one of the disks by folding the disk and measuring the height. Since the disk is folded to make it easier to find the height, divide the measurement appropriately to find the height if the disk was not folded.
-
Graph the proportional mass vs radius2 relationship and determine the equation for the best-fit line.
Precision:
-
The meter stick’s precision our group used was 1 millimeter (0.1 centimeters), since the meter stick used to measure the radius of the disks had markings down to the tenth of a centimeter. The measured radii of the disks in the data table is noted to the nearest hundredth of a centimeter, because of the 2/5/8 rounding rule, which added an extra digit of precision to the measurement.
Data Table:
Radius2 (cm2) vs. Mass (grams) & Radius (cm)
| Radius (centimeters) | Mass (grams) | Radius2 (centimeters2) | |
|---|---|---|---|
| 5.32 cm | 0.37 g | 28.3024 cm2 | |
| 6.92 cm | 0.71 g | 47.8864 cm2 | |
| 4.12 cm | 0.25 g | 16.9744 cm2 | |
| 3.08 cm | 0.13 g | 9.4864 cm2 | |
| 2.28 cm | 0.08 g | 5.1984 cm2 |
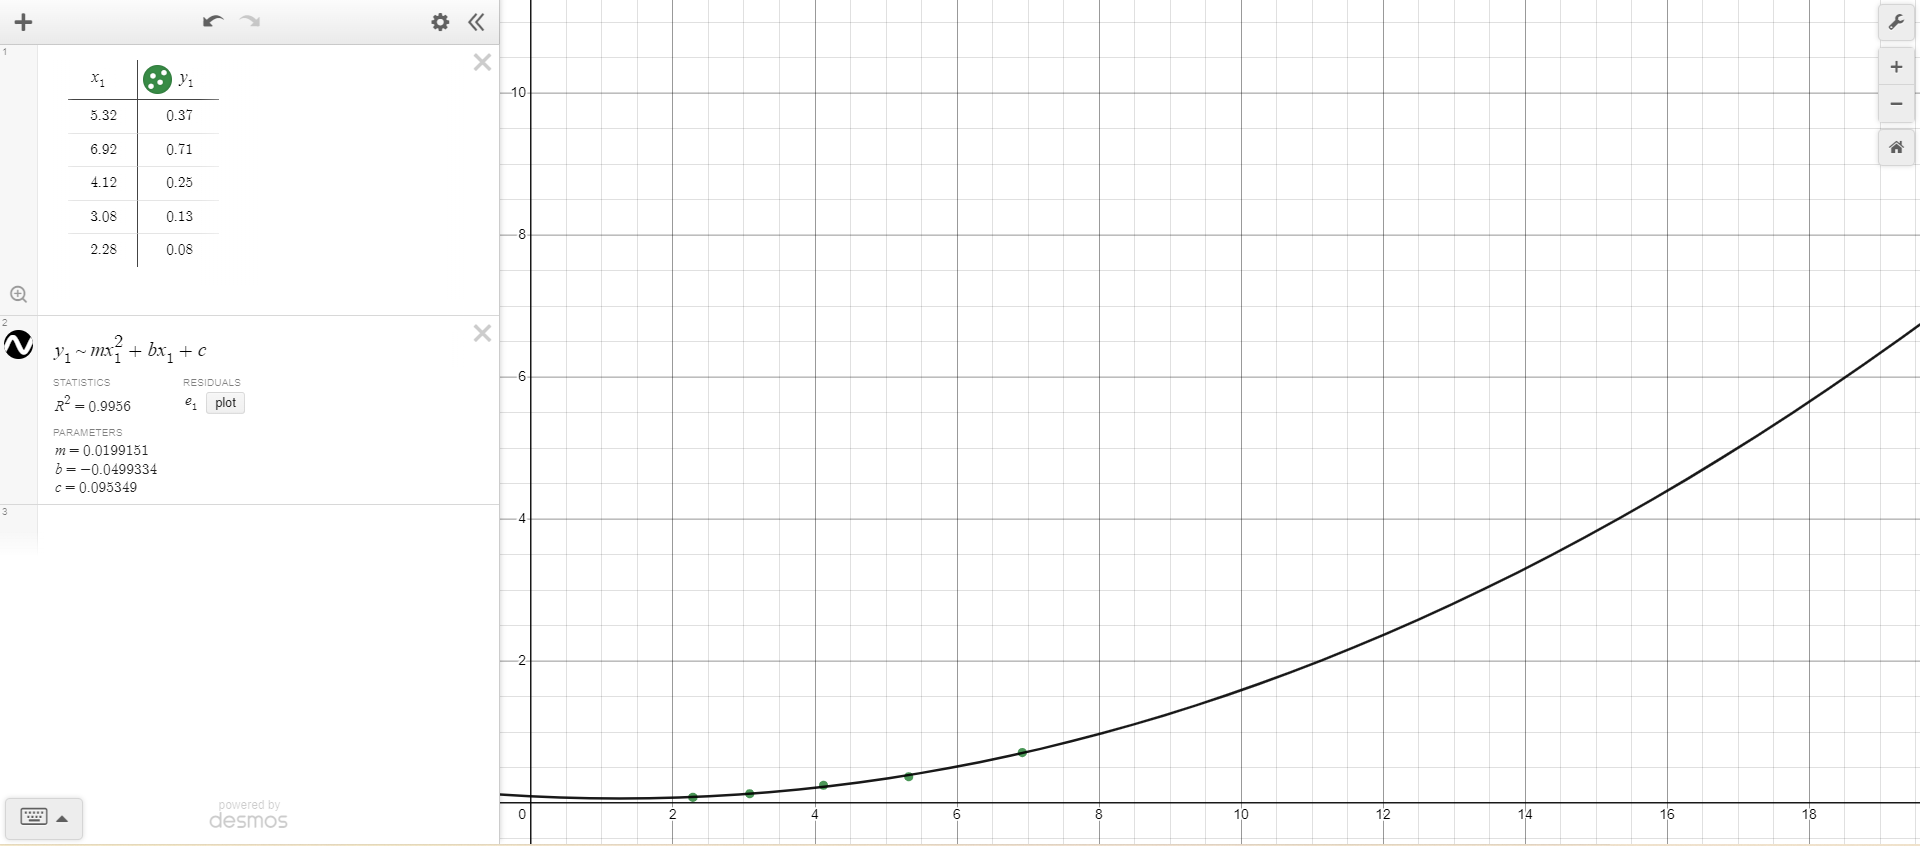
This is a nonlinear regression.
Equation: y = 0.0199151x2 - 0.0499334x + 0.095349
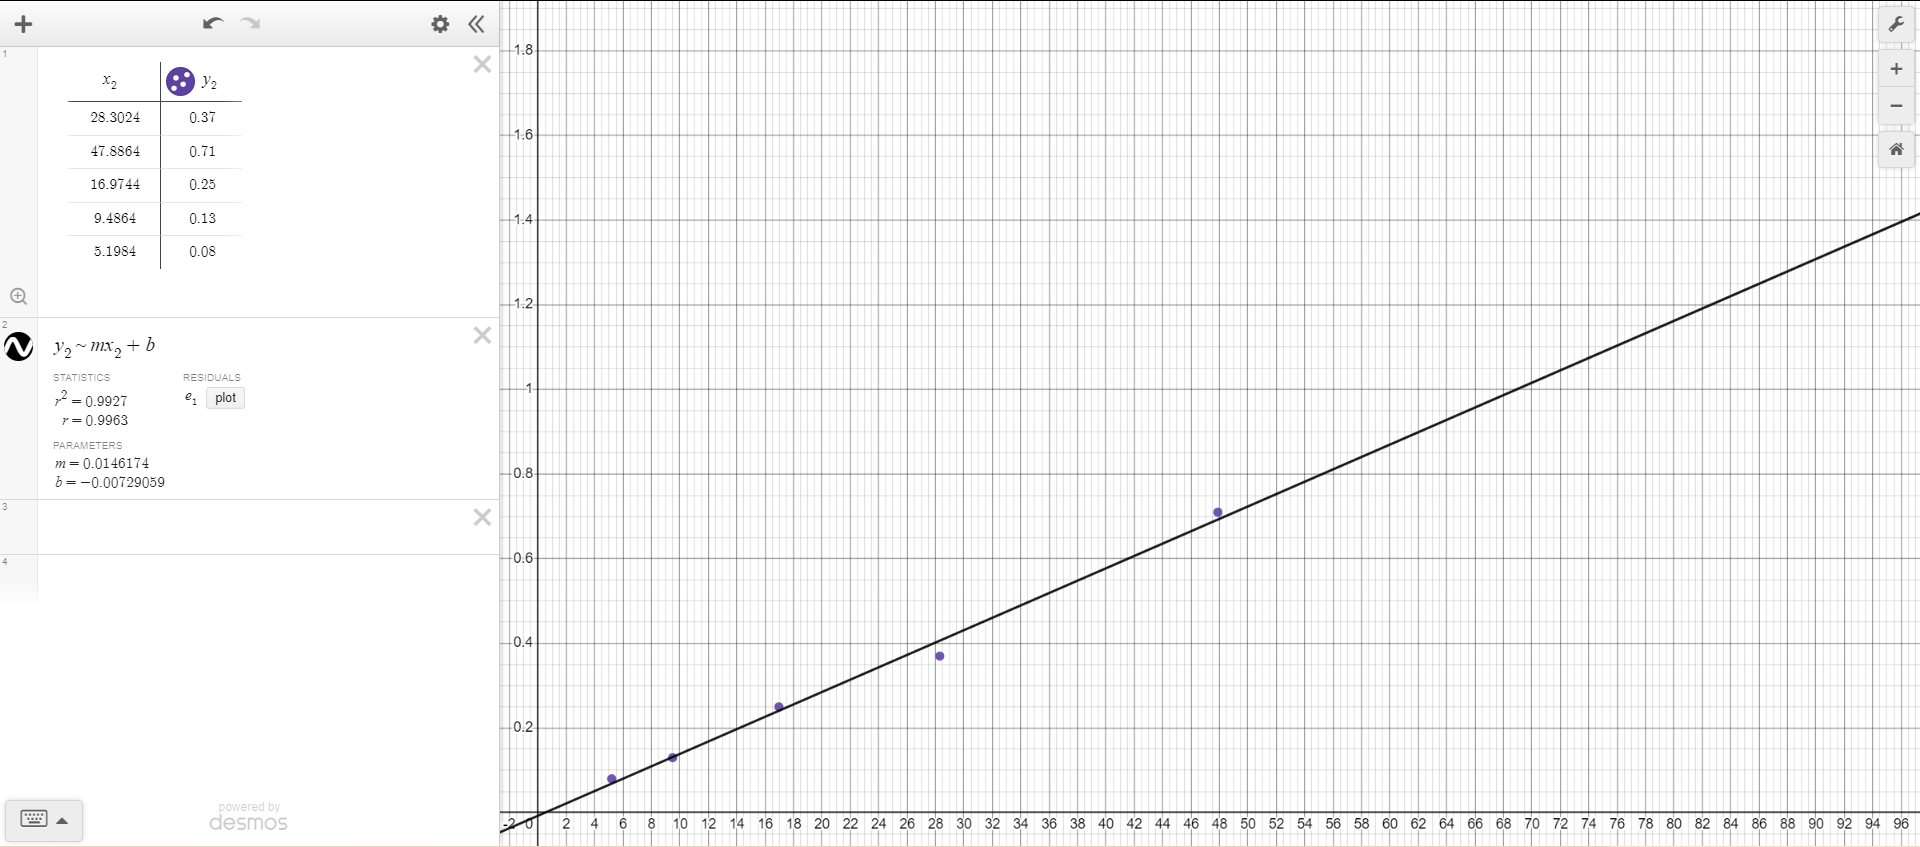
This is a linear regression.
Line of Best Fit Equation: y = 0.0146174x - 0.00729059
Analysis Questions:
-
From the line of best fit, the independent variable represents the radius2 (centimeters2). This is because there is a linear relationship between the measured mass of each disk in grams and the corresponding squared radius values (in centimeters2) for each disk.
-
The slope of the line of best fit has units of grams/cm2. In the original equation given in the lab, mass is equal to density multiplied by the disk’s surface area multiplied by the height of the disk. The surface area of the disk can be calculated through the formula for the area of the circle, or pi multiplied by the radius squared. Since the density, pi, and height values are all constant, they make up the coefficient for the slope of the line of best fit equation. Density is measured in grams/centimeter3, pi is a numerical constant, and height is measured in centimeters, and multiplying these values together gives units of grams/centimeter2. To verify that these are the correct units, the remaining part of the original equation is radius2, which has units of centimeters2, and multiplying the slope units (grams/centimeter2) by centimeters2 would produce a value in grams, which is the unit of measurement for m (mass). Since the y-value of the line of best fit equation has units of grams, the y-intercept (-0.00729059) must also be with units of grams, in order to produce the same unit on both sides of the equation:
-
In this case, g represents grams, and cm represents centimeters.
-
y = mx + b
-
g = (g/cm2 * cm2) + g
-
g = g + g
-
g = g (verification)
-
-
-
Yes, in ideal conditions, the “b” in the y = mx + b formula should be zero, as a disk with a radius of 0 centimeters would have a mass of 0 grams.
-
Best-Fit Line Slope: 0.0146174
-
The “thickness” of the cylinders is approximately 0.00125 centimeters.
-
Density * (\pi) * Height = Slope
-
Density * (\pi) * 0.00125 cm = 0.0146174
-
Density * 0.003925 cm = 0.0146174
-
Density = 3.72417834 (\approx) 3.72 g/cm3
-
The actual density of aluminum is 2.7 g/cm3.
-
Percent Error: (3.72 g/cm3 - 2.7 g/cm3)/(2.7 g/cm3) x 100% = 37.778% (\approx) 38%
-
-
Our calculated density for the aluminum foil disk (3.72 g/cm3) was slightly larger than the actual calculated density of aluminum (2.7 g/cm3), as shown by our positive 38% error. Our number was likely larger than the actual value because of the inability to accurately measure the height of each disk, leading to an under measurement, creating a higher density value than expected. Furthermore, the measurement of the disk area may have been slightly inaccurate due to each disk not being perfectly circular.
Synthesis Questions:
-
Disks with a greater thickness would correspond to an increase in the slope of the best-fit line. A greater thickness with an unchanged radius would result in a greater volume of the disk, leading to an increase in the slope of the line. The experimental density would stay the same, since the increased thickness would be reflected in the increased slope of the line. The slope is equal to the density multiplied by pi (constant) by the thickness of the disk, and with the increased thickness already accounted for in the increased slope, the density would remain the same as before. Disks with a greater thickness would have allowed for a more accurate measurement of the height, creating a more accurate density measurement.
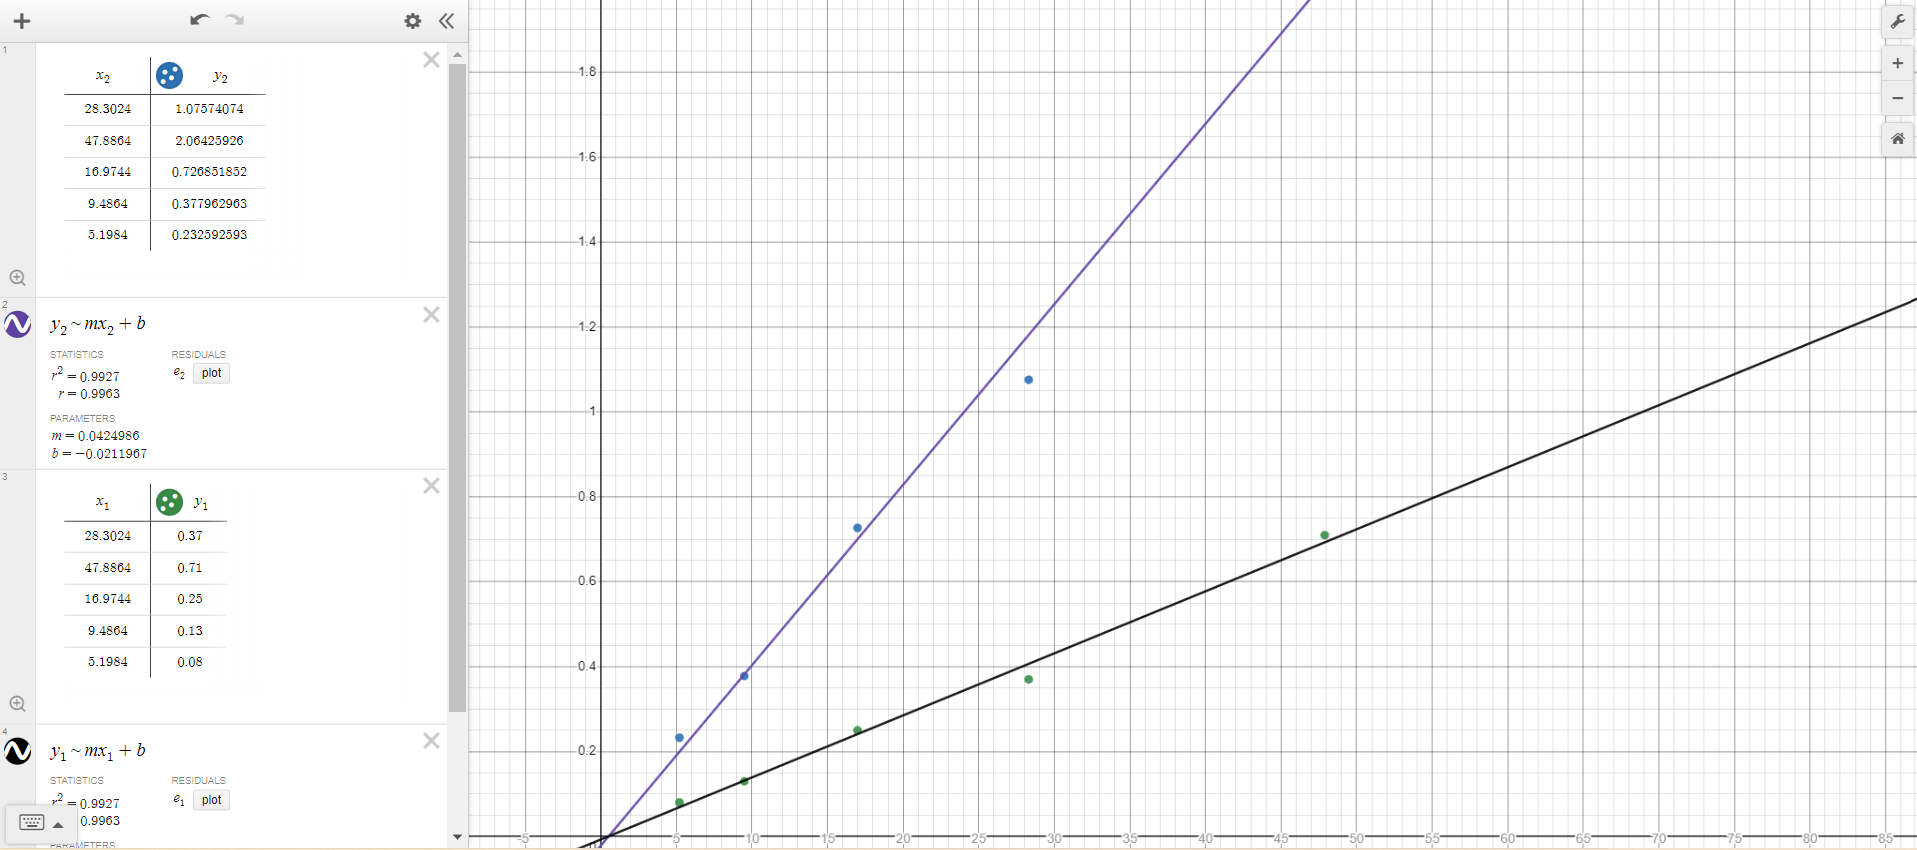
-
In this modified graph, the purple line (also circled) represents a scenario in which steel disks with the same thickness were used in the experiment. The slope for the line representing the steel disks is steeper than the line for the aluminum foil disks, since the density of steel (7.85 g/cm3) is much greater than that of aluminum (2.7 g/cm3), and the slope is directly proportional to the density. The purple line in the above graph has a slope of approximately 2.9 times greater than the best fit line showing the relationship between mass and radius2, as the density of steel is 2.9 times greater than that of aluminum.
-
Work:
-
Slope: 122 kg/m2
-
Thickness: 0.5 cm
-
Density * (\pi) * Thickness = Slope
-
Density * (\pi) * 0.5 cm = 122 kg/m2
-
Density * 1.57 cm = 122 kg/m2
-
122 kg/m2 x (1.0
m2/10,000 cm2) x (1000 g/1.0kg) = 12.2 g/cm2 -
Density * 1.57 cm = 12.2 g/cm2
-
Density = 7.77 g/cm3
-
This is closest to the density of iron, which is 7.8 g/cm3. Therefore, the unknown material that these disks are made of is iron.
-
Multiple Choice Questions:
-
Mass = Density * Volume
-
Density * Area * Height = Mass
-
Density * (\pi)r2 * Height = Mass
-
C = 2(\pi)r
-
C2 = 2(\pi)r2
-
C2/(2(\pi)) = r2
-
Density * (\pi)(C2/(2(\pi))2) * Height = Mass
-
Mass = (Density * Height * 1/4(\pi)) * C2
-
Slope = (Density * Height)/(4(\pi))
-
Therefore, E is the correct option.
-
-
SKIP
-
Volume of a Sphere = 4/3(\pi)r3 (r = radius)
-
Mass = Density * Volume
-
Mass = Density * 4/3(\pi)r3
-
Mass = (Density * 4/3(\pi)) x r3
-
Since density and 4/3(\pi) are constants, the mass would need to be plotted versus the radius3, so the correct option is C.
-